Insights
Too Big to Ignore: The Momentum Factor
Featured

All Articles ()
There are currently no articles for this filter
KEY POINTS
1. Over the short term (nine months), the momentum factor is at a level occurring only 3% of the time since 1995, when factors began being measured.
2. We believe it's important to focus on why the dominance of momentum factors impacting performance is at a high.
3. We believe a broadening of the market, which has slowly begun over the last few months, is very likely to continue.
As anyone watching U.S. equity markets is aware, the winners have kept on winning, leading to the current narrowness. However, the relevance and impact of this historically unprecedented momentum, and its resultant effects on portfolio performance, may surprise even savvy market watchers.
In late 2022, we wrote a blog titled "Looking Under the Hood: Not all Equity Returns Are Equal," explaining the importance of understanding what is driving portfolio returns in order to eschew unintended risk. We also dug into the various elements that drive tracking error, namely security selection and factor exposure.
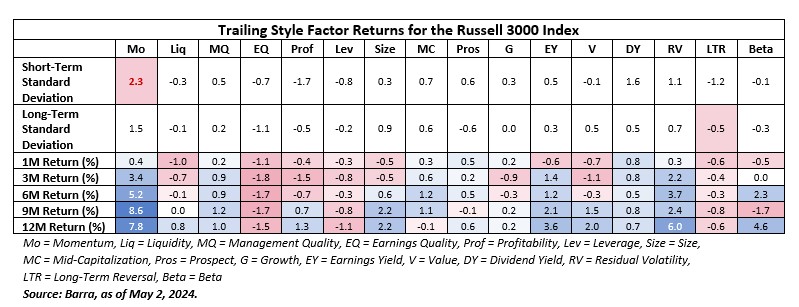
Over different times, factors tend to ebb and flow in terms of what is driving and what is stalling portfolio performance. By definition, and as can be seen from the table below, most factors are typically within 1.5 standard deviations or less of their central tendency.

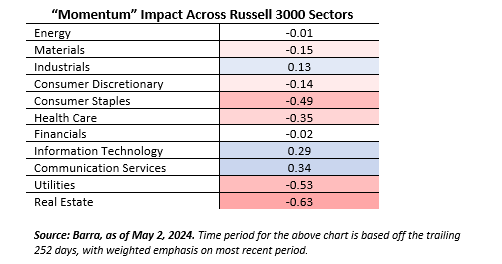
Over the short term (nine months), however, the momentum factor2 is now at a 2.3 standard deviation, which has only happened 3% of the time since 1995, when factors began being measured. Within that number, the sectors primarily driving this momentum run within U.S. equities (as measured by the Russell 3000 Index) have been information technology and communication services.

As we said in the 2022 blog, our strategies are primarily driven by security selection. However, as we review risk reports, along with our typical meaningful contribution from security selection, the dominance of factors coming into play to impact performance is at a high. In our view, this trend is too notable to ignore.
We are consistent bottom-up, value investors, regardless of trends in the market. Our team seeks out leading companies we believe are priced at a discount to their intrinsic value due to being mispriced, out of favor, or misunderstood by the market. These are not the companies that have been driving this momentum in the market. Fortunately, our security selection year-to-date has outdone this strong factor phenomena.
In addition to being consistent value investors, we are also long-term investors. With how stretched the momentum trade currently is, we believe a broadening of the market (which has slowly begun over the last few months) is very likely from here.
Bottom line: We believe consistency is key amid uncertainty, and we continue to follow a proven investment philosophy and process to construct portfolios for clients with an emphasis on stock-by-stock decisions, based on an assessment of risk and reward. A relentless focus on acquiring leading companies when the market offers them at discounts to their intrinsic value is essential to adding value for clients over time, regardless of market trends.
1In capital market theory, momentum factor is a well-known market anomaly in which securities that have risen in recent months tend to continue to rise.
2Ibid.
Forecasts and/or estimates provided herein are subject to change and may not actually come to pass.
Russell 3000® Index measures the performance of 3,000 U.S. large-cap, mid-cap and small-cap stocks and is designed to represent approximately 98% of investable U.S. equities by market capitalization. Unless otherwise stated, index returns do not reflect the effect of any applicable sales charges, commissions, expenses, taxes or leverage, as applicable. It is not possible to invest directly in an index.
Correlation is a statistical measure of how two securities move in relation to each other.
Standard Deviation measures how widely individual performance returns, within a performance series, are dispersed from the average or mean value.
Past performance is not a guarantee of future results.

